


PetPace 2.0 is the first and most advanced wearable device for pets that offers a unique, patented AI platform for the assessment and management of pets’ health, safety, and well-being.
The PetPace smart, non-invasive collar is equipped with an array of sensors and backed by sophisticated algorithms that can accurately monitor a range of animals’ biometrics, including vital signs, behavior, and location. Advanced analytics, using machine learning models, turn the data into actionable insights for pet owners, veterinarians, and researchers.
PetPace technology has been thoroughly validated and used by numerous universities and law enforcement agencies worldwide.
Revolutionary, unrivaled, patented Artificial Intelligence platform for the assessment, detection, and management of pets’ health and well-being.
Continuous collection of unprecedented breadth and depth of physiological and behavioral data
Huge, unmatched pets’ health and wellbeing database – vital signs and beyond
Advanced, real-time analytics and AI models provide a comprehensive, personalized view of a pet’s health status, habits, and routine, highlighting anomalies or negative trends
Early detection of medical and behavioral problems – improve outcome
Disease management – response to treatment, personalized management, pet owner engagement
Share data, history, and analytics on a common digital platform
A sophisticated, customizable alert engine provides message distribution via push notification, SMS, email, or phone to the owner and/or veterinarian
Universal access to a cloud-based database enables remote patient evaluation
Web and mobile applications (Android and iOS)
PetPace technology is unique in the breadth and depth of data it captures and its unmatched advanced analytics that enables early detection of diseases, close real-time monitoring, and clarification of the effect of interventions and treatments.
PetPace users under the Research program have full access to all the features and services that pet owners have, plus a lot more.
You’ll get
- Raw data download on-demand
- Selection of data sampling rate (2/5/15/30 min)
- A multiple-users, multiple-pets, multiple-locations environment support
- Access to our web and mobile apps
- Customized access to the data portal (you can control who has access to the data and who is blinded to it)
Extra services and benefits for the research version
- Access to advanced charts and analytics
- Additional, customizable special analytic tools
- Team practical training and guidance
- VIP technical support
Of course, you will also enjoy full access to all the standard features of the system, such as:
- Vital signs tracking – temperature, pulse, respiration, HRV, activity, posture, and calorie data
- Calculated indexes – sleep quality, behavior routine, and more
- Customizable alerts, goals, and insights
- Workout score – assessment of physical activity and intensity of exercise sessions
- Data Analysis – trends, comparisons, baseline, and more
- Advanced AI models for detection and prediction of health problems:
- Baseline health profile and early detection of anomalies (after 7 weeks of use)
- Daily pain score (after 10 weeks of use)
- Daily wellness score (after 12 weeks of use)
- Location (GPS) data
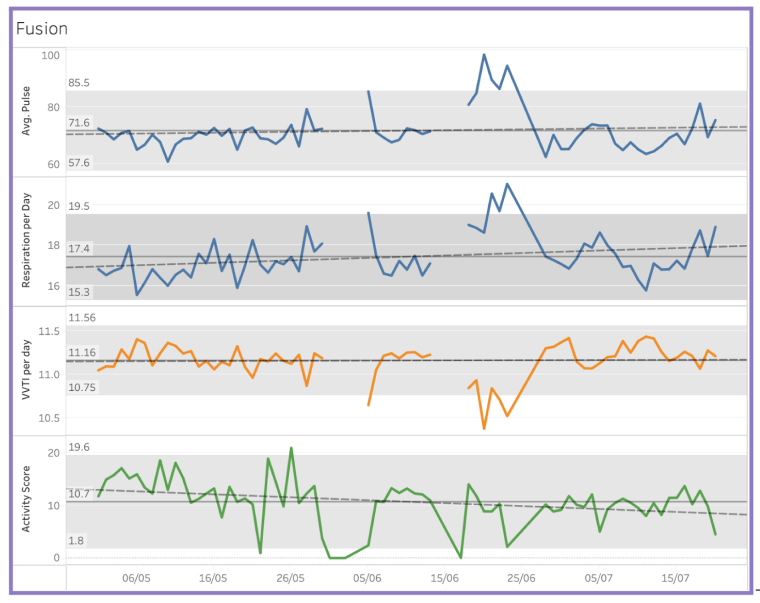
A customizable dashboard displaying multiple biometrics of interest in real-time on the same time scale, each with a calculated normal range, overall average, trend lines, and indications of times when values deviate from the normal range.
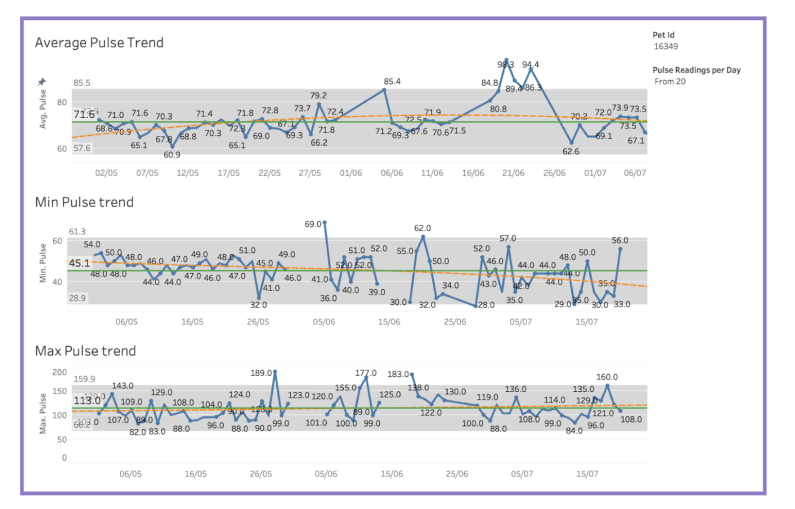
Select a biometric and drill down into various parameters, such as daily average, daily minimum, daily maximum, STD, etc., for an in-depth analysis of the behavior of the biometric of interest over time.
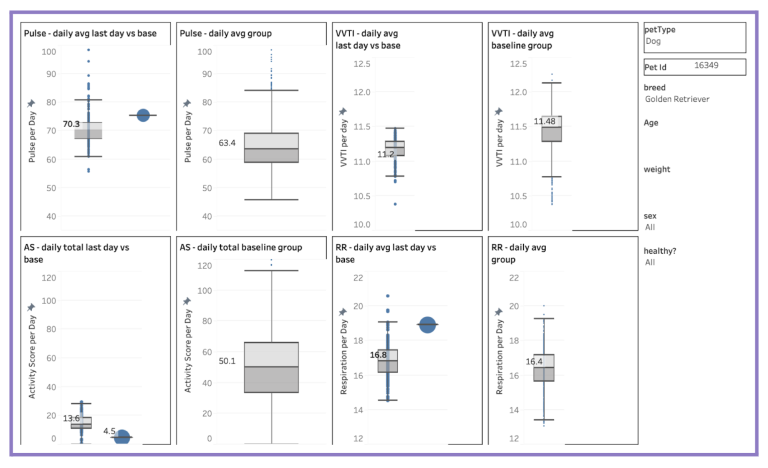
Create a normal distribution of values (box plot) for biometrics of interest and compare a pet’s values today to its own historical norm, or to a reference group of dogs that can be customized per age, weight, breed, sex, location, etc.
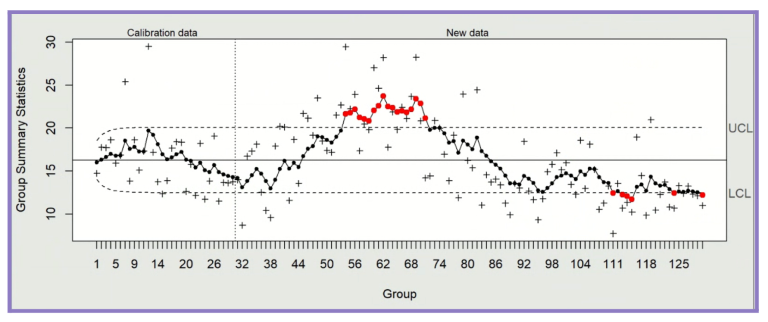
Advanced, Machine Learning models use collected data to create a personalized normal range for any pet with any condition and for each biometric of interest, and alert you when a change had occurred (either an increase or decrease in the pet’s values). The personalized normal range automatically updates to accommodate chronic changes in the pet’s condition.
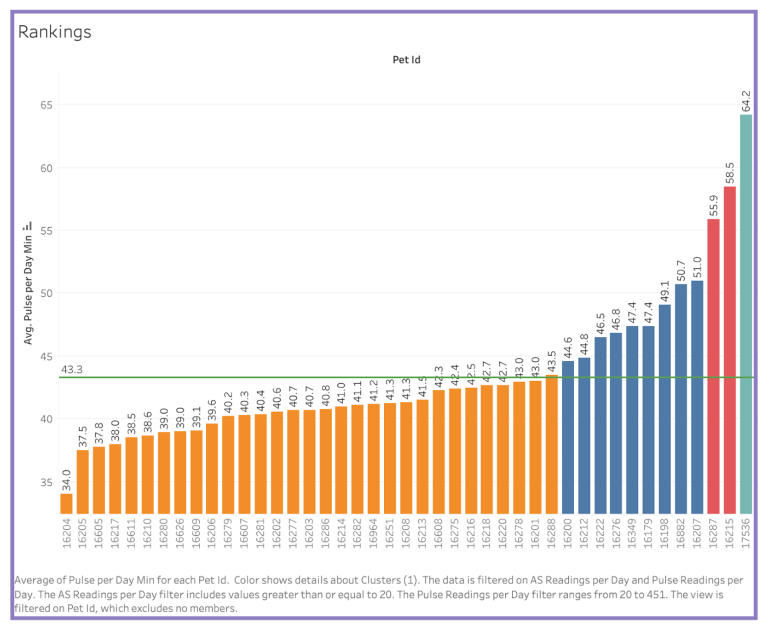
Select a reference group of pets, based on age, weight, breed, sex, geographical location, health status, etc., and rank them based on selected parameters, such as Activity Score, Resting Pulse rate, etc.
Divide the group into clusters based on mathematical models that illustrate their relative performance.
See where a specific pet fits within the ranking and identify room for improvement.
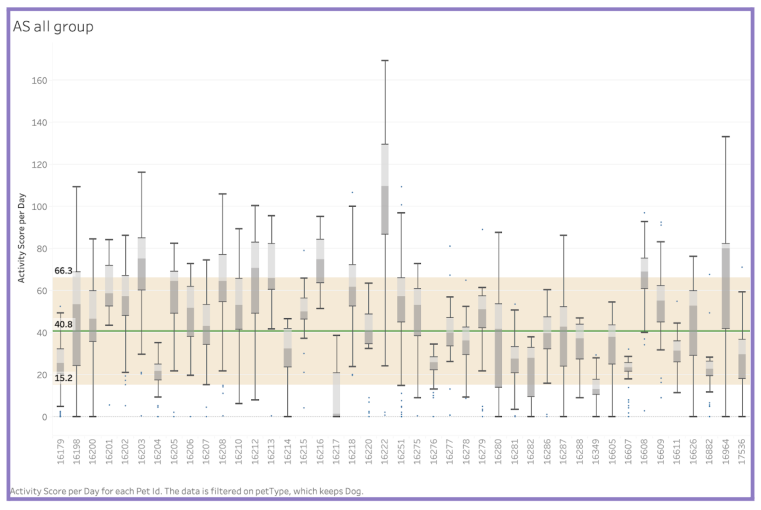
Each pet may have a different distribution of values for any selected biometric. Compare the distributions of various pets, generate a population normal distribution, and see how each pet performs compared to the general norm.
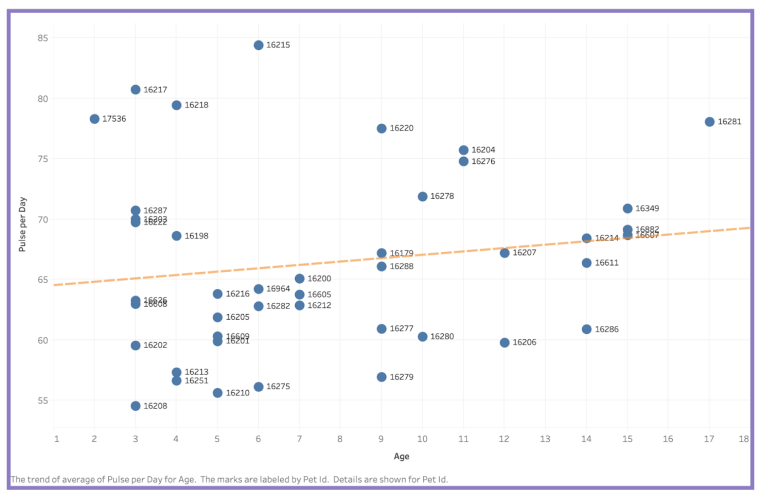
See how selected biometrics change in correlation with certain dimensions (a dimension can be age, weight, or any other continuous variable). This correlation can be fine-tuned by filtering pets with certain conditions, or any other relevant parameter. Next, use mathematical models to create benchmarks and find out how each pet performs against the benchmark.
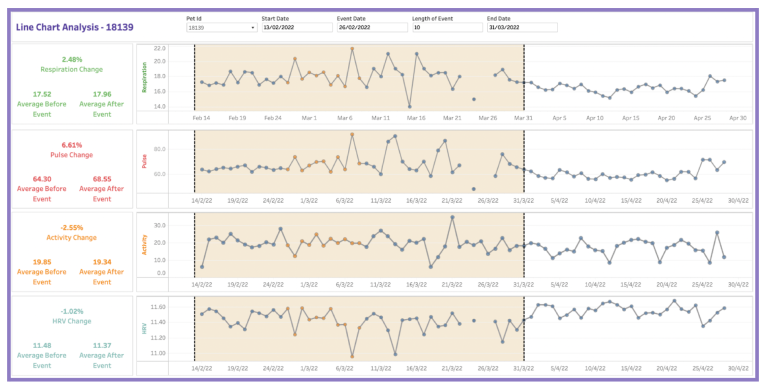
Select the pet you want to evaluate, the biometrics and time frame of interest, and enter a date of an ‘event’, for example, the administration of a novel drug. You can also customize the length of the events, to account for the time that it may take the event to take effect. For example, certain drugs may take several days before a response is expected, and this tool is designed to accommodate for that. These parameters can be edited anytime to examine how they may affect the results.
The system automatically aggregates data before and after the event (excluding the time of the event itself), compares the values, and shows you the calculated change, which is the result of the ‘event’.
The results are displayed in graphical and numerical formats and can be exported easily.
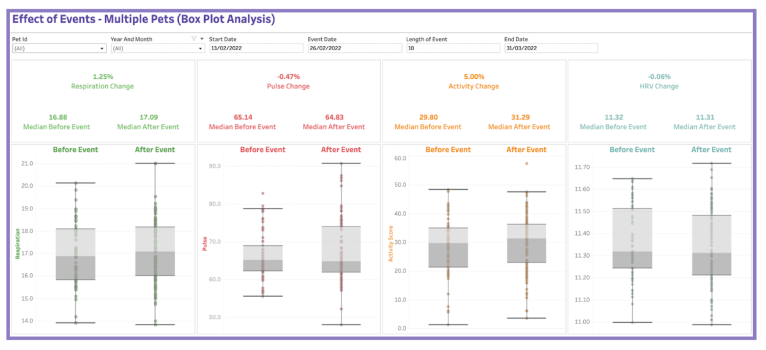
Combine the data of multiple pets to assess the cumulative effect of the ‘event’ in question.
The convenient user interface allows you to select or de-select certain pets from the calculation, and enter different parameters for each pet (start/end/event time/length) to correspond with the study’s design and actual timeline.
The system calculates and displays the cumulative values of the group before and after the event, and the total change (if any) the group experienced as a result of the event. You can also select the type of results to calculate, such as average, median, distribution, Min/Max, etc.
You can download the raw data collected from each pet in a csv format, which can then be opened in any common spreadsheet software, so you can run your own statistics at will.